• Home
  • About MPE2013 India
  • Exhibits
  • Gallery
  • Contact Us

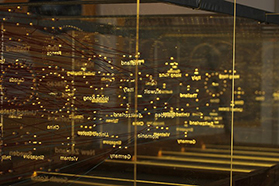
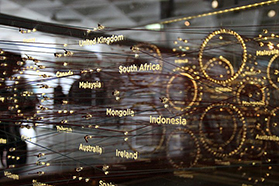
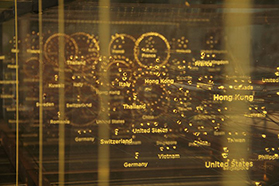
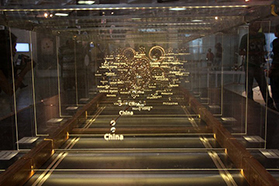
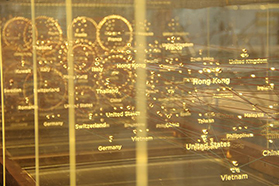
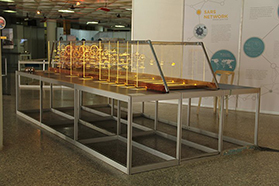
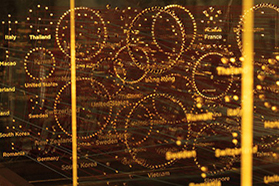
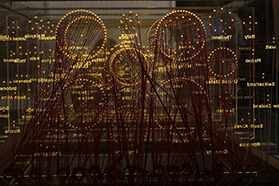
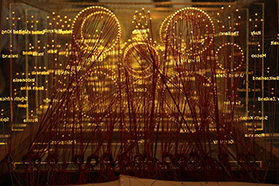
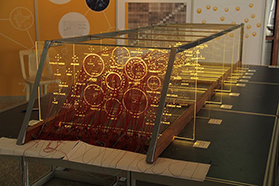
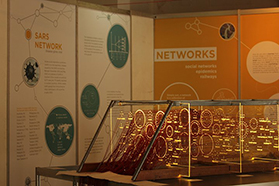
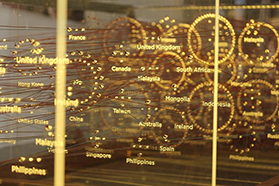
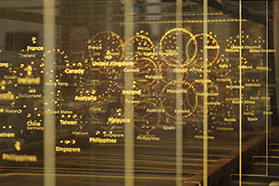
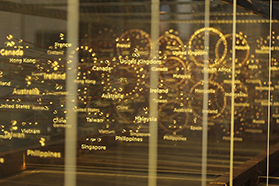
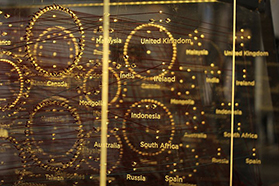
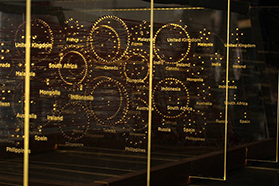
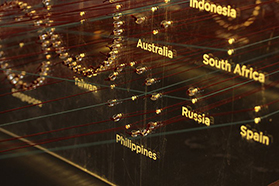
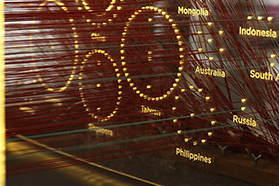
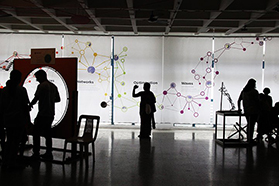
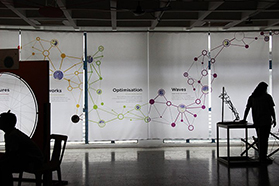
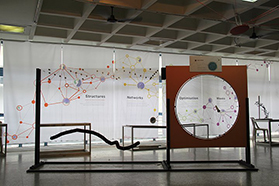
Welcome to the Network Graph

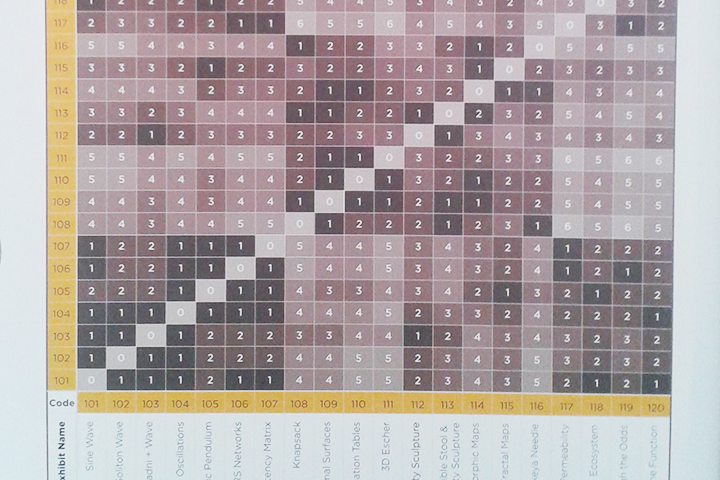
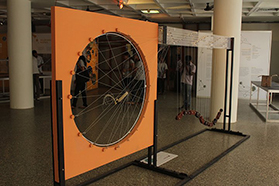
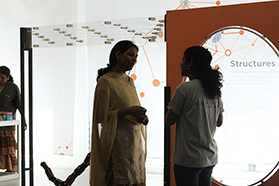
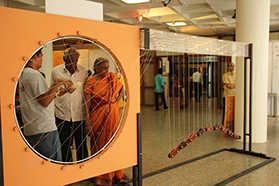
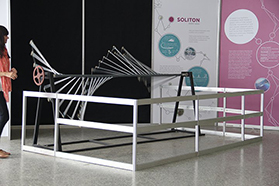
All exhibits in the Mathematics of Planet Earth - 2013 are related to each other - either directly or indirectly. The complete exhibition can be represented in the form of a network graph given below. For more information read about it at the "Adjacency Matrix" Page.

Back to Exhibits

X


Escher also worked on regular solids, known as polyhedra, that he extensively explored in many of his works. His woodcut “Three Intersecting Planes” is an especially illuminating example of this. In the present exhibit, the simple fact that two planes meet along an edge and that three planes meet at a vertex is demonstrated in an aesthetically appealing way.


 Download PDF (For Printing)  Back to Exhibits

X

This exhibit is designed to illustrate the difference between objects (in this case, curves) which are fractals from those which are not. Let us begin with commonly encountered objects which are not fractals: a football, the smooth surface of a computer screen or a book, the boundary of a cricket field, train tracks. Indeed, most man made objects are non-fractal objects.

On the other hand, approximate fractal propertie are observed in many natural objects, such as coastlines, mountain ranges, river networks, lungs, path of lightning, clouds, etc. A quick glance at this list may suggest that fractal properties are related to “non-smoothness” of an object and that is precisely the concept that is captured by the mathematical definition of a fractal.


 Download PDF (For Printing)  Back to Network Graph
X

The concept of a function is one of the most fundamental ideas in mathematics, and in life in general. Like any functional unit we encounter, a mathematical function takes an input and gives an output. The inputs can be from a pre-defined set, for example, all 29 integers, or all positive real numbers (or in case of a living being, food and air) and the outputs are also usually limited to a specific set, for example the set of even numbers, or the set of complex numbers (or in the case of a living being, air, water, solid waste).

We use mathematical functions all the time. When we look at a time-table for a train, it indicates the time as a function of location - you tell me the city (input) and the time table will tell you the time (output). Of course, if the input city is not in the set of cities where the train stops, there is no output

Functions which depend only on one factor are most easily represented by a graph - the input is shown on the horizontal axes and the output is shown on the vertical axis. The “walk the function” exhibit, which was borrowed from the Mathematikum in Giessen, Germany, is a way to make this idea of a “graph” perceptible - the visitor has to walk in such a way that the line indicating her/his position on the screen follows a predefined graph, or in mathematical terms, the graph of the position versus time would trace a predefined curve.


 Download PDF (For Printing)  Back to Network Graph
X

We can begin with two experiments.

(1) Draw a triangle on a globe. Of course there are readymade triangles on the globe, described by any two longitudes and the equator. Now measure the three angles of this triangle and sum them up. Notice that their sum is never 180 degrees. Why is that so?

(2) Take a large sheet of paper, and try wrapping it around a football or a globe, such that the paper never gets wrinkled. Impossible, right? Next try cutting this sheet of paper into 5-8 pieces (say polygons such as hexagons), and try pasting these polygons on the globe, again without overlapping and no wrinkles. Not possible again! Now cut a large number (100s) of tiny polygons, and then you may notice that it appears possible to achieve this goal. More so because the wrinkles are not going to be visible on such small polygons. What does one make out of it?

All the above are manifestations of the same phenomena: that the earth or the football is not flat, but is spherical and curved! When we want to project such a curved surface onto a flat sheet, it cannot be done without some distortion. E.g. a triangle on the sphere whose angles do not add up to 180◦ cannot be projected onto a flat sheet, because if this could be done, its angle would sum up to 180◦ this phenomena. Notice that the map as seen on the flat surface is highly distroted - the areas, the angles, and the distances are all wrong! But when you see its reflection on the curved surface of a cylinder, it looks just fine. Mapmakers use the mathematics behind such “reflections” or , which is clearly a contradiction! The anamorphic map exhibit shows precisely “projections” in order to make various kinds of maps which reduce one type of distortion or the other – either the angles or the distances or the areas. But no map on a flat piece of paper can reproduce all the three aspects exactly for the whole earth, and that’s a mathematical theorem, so however hard you try, you will never be able to it!


 Download PDF (For Printing)  Back to Network Graph
X

The original inspiration for the knapsack problem is a puzzle that we are all familiar with. It is one that a vegetable vendor has to solve every day: the vendor goes to the wholesale market to pick up vegetables to sell on a particular day. Of course she cannot carry more than a certain weight, and the total volume cannot exceed the volume of the basket. There are several, at least 10-20, different vegetables she may choose. She knows the profit she can make per kilo of each of the vegetables, and the volume per kilo for each of these as well. Given all this data, she has to choose vegetables that will fit in her basket and are within the weight she can carry, but at the same time will give her maximum profit. This is indeed a complex mathematical problem, but most vendors find a solution for such a problem every day!

This kind of problem is known as “constrained optimization:” the limits on weight and volume are the “constraints” that cannot be exceeded, whereas “optimization” refers to the aim of trying to maximize the profit. “Knapsack problem” is a colloquial name for such problem referring to a problem that a thief may face, very similar that of the vegetable vendor.

A slightly simpler version of this problem is illustrated in this exhibition..


 Download PDF (For Printing)  Back to Network Graph
X

Natural systems are dynamic. Trees bloom in spring and shed leaves in autumn; A forest composed of such trees changes character over seasons, years, decades; A region containing such forests, rivers, desserts, and other ecosystems reflects these changes; Even the whole earth is showing possibly irreversible signatures of climate change.

Some of these changes are a simply due to the natural variability of dynamical systems - a pendulum swings due to gravity, the changing position of the sun causes seasons, the monsoon rains come and go every year. But external factors such as the human interactions with these systems, for example, construction of a dam or a factory, or reforestation of an area, also affect the progression of these changes. Some of these changes due to external factors can occur quite suddenly instead of gradually - something like the difference between going over a cliff instead of rolling down a slope! These sudden changes may be irreversible and are often called “tipping points.” They may prove to be catastrophic, for example, in the context of ecosystems or other complex systems

The physical exhibit on ecosystems and tipping points provided a illuminating example of such a phenomena. Here the position of a light ball (a table tennis ball) indicated the state of a system, for example, say the amount of vegetation. We could think of valley on the right to correspond to a forest landscape (henceforth called forest valley) while the valley on the left to correspond to a dessert landscape (to be called dessert valley).

The blowers played the role of external factors such as cutting down trees or reforestation. Two different types of systems were illustrated by two different “tracks” on which the ball moved.

• In one of them with a tall peak, the ball stayed in the valley which corresponded to large amount of vegetation, even in the presence of external factors. This showed the types of systems that do not show the “tipping point” behaviour. • In another type of system with a short peak, the ball could “tip over” to the dessert valley even with a small external push (from the blowers). This type of system is thus capable of the tipping point behaviour. Note that since the depth of the dessert valley was deep, the ball would never revert back to the forest valley, showing irreversibility of this transition. (Of course we can pick up the ball and move it to the forest valley - that may correspond to building a canal from Ganga to Rajasthan!


 Download PDF (For Printing)  Back to Network Graph
X

The dice used in this experiment are a bit special: some of their sides have a red dot while all others have a blue dot, for example, 2 sides with red dots and 4 sides with blue dots. The game goes as follows: A large number of dice are thrown, and ones showing the red color are collected, and stacked in a column. The remaining dice are thrown again, and the ones showing red are again collected, and stacked in a column next to the earlier column. This process is repeated until one exhausts all the dice. Watch how the height of the columns vary!


 Download PDF (For Printing)  Back to Network Graph
X

Have you thought about how the water seeps through loose soil or a sponge but not through a hard stone? Think of the balls rolling down through the squares in the exhibit as water going through a rock. Whether the rock is permeable or not, that is whether the water can seep through the rock or not, is determined by whether it can find a path going from one end to the other. This is the phenomena of percolation leading to the property of permeability. The simple probabilistic experiment in this exhibit illustrates this idea. Can you arrange the squares in a say so as to make this “rock” permeable or impermeable?

Also, how many of the combinations will lead to a permeable exhibit while how many will lead to an impermeable one? If you were using coins to decide the arrangements of these squares, will you be more likely to come up with a permeable arrangement?


 Download PDF (For Printing)  Back to Network Graph
X

Imagine having to move a ladder, or a large stick, from one room to another or suppose one is trying to park a car in a tight spot. Most often in such a situation one has to navigate through a rather cramped space. Both tasks require a great deal of ingenuity and dexterity

In the year 1917, the japanese mathematician S. Kakeya considered the problem of finding the area of the smallest convex set in the plane inside which a needle of unit length can be reversed, i.e., turned around through 180◦ . (A “convex set” is nothing but an area which has no “spikes” e.g. a circle or a triangle is convex whereas a star in not convex.)

Indeed, Kakeya conjectured that an equilateral triangle of unit height is the smallest such set; he also observed that if the convexity condition is dropped, that is, if we allow for shapes such as stars or octopus, with “spikes,” then a smaller set is possible. The more interesting question of finding the smallest set (without the convexity condition) in which to turn the needle came to be known as the Kakeya needle problem.


 Download PDF (For Printing)  Back to Network Graph
X

We can even consider the various exhibits in this exhibition as nodes of a network. One way to build a network from these nodes is the following: if the mathematical concepts behind two exhibits are closely related, then these two nodes can be connected by an edge. For example, the standing waves on the spring are mathematically very closely related to the oscillations of a pendulum, so these two nodes in the “network of exhibits” are connected by an edge, but there is no immediate mathematical connection between these standing waves and the anamorphic maps, so they are not connected by an edge. The matrix representation is obtained by putting the number 1 when an edge (or a connection) exists between the two concepts and the number 0 when it does not.

One thing that is clear from the adjacency matrix, is that mathematics has a great unifying power, because in many cases, the mathematical description of seemingly unrelated topics brings out a natural and close relation between them. For example, the fractal coastlines of a country may seem far removed from the sine wave exhibit, but from the network graph, we see that fractals are closely related to chaotic pendulum, which in turn is a for of oscillation, which in turn is related to the sine wave, so there is a “degree 3” connection between fractals and sine waves!

This phenomena is not entirely surprising. Take the example of finding a relation between you and a randomly chosen person in a village in Australia. If you write down a list of all your friends and relatives on one line, then the list of their relatives and friends on the second line and so on and so forth, and if the other person in Australia starts making such a list, the surprising aspects of such lists seems to be that there will be common names appearing in both the list, usually within the first 3-6 lines! So you are related to everyone else on the earth with only about 6-7 links!

 Download PDF (For Printing)  Back to Network Graph
X

Have you ever wondered whether there is a mathematical description of the way diseases spread in a population, either locally such as in the case of a dengue epidemic in a city such as Singapore or Delhi, or globally such as in the case of the SARS epidemic around the world? In fact there is not just one, but many different such descriptions. One of them is in terms of networks. This could be in terms of places through which the disease spreads (as in the case of the actual exhibit described below); Or it could be in terms of the network of individuals who get infected or may infect others (some times through a “carrier” such as a mosquito in the case of dengue).

Severe acute respiratory syndrome (SARS) is a viral respiratory disease caused by the SARS coronavirus. An outbreak of SARS in Southern China caused an eventual 8,273 cases and 775 deaths in multiple countries between November 2002 and May 2003. Within weeks, SARS spread from Hong Kong to infect individuals in 28 countries in early 2003.

The installation contains a total of nine panels representing the duration across which the epi- demic spread. Along with displaying the network of the spread of the epidemic, it also shows the exponential nature of its growth. What we see is the spatio-temporal spread (in space across the globe, and in time across just a few months) of the disease.

In the installation, the strings cumulatively move towards the last panel in concentric circles. The central string represents the probable source from where the virus was imported into the country. The inner circle of strings signifies the number of cases in the country x100 and the outer circle signifies the number of cases in the country x1.

 Download PDF (For Printing)  Back to Network Graph
X

Soap bubbles are formed by the simple physical principle of surface tension, whose mathematical manifestation is the concept of “minimal surfaces” – the idea that soap films always minimize their surface area.

This seemingly simple principle leads to visually appealing and mathematically interesting shapes: individual bubbles are spherical in shape maximizing the volume enclosed, the bubble clusters set- tled on a plane surface display a hexagonal tessellation, the soap films formed by irregular shapes can show a dazzling variety.

Mathematically, some of the soap bubbles are classic examples of surfaces with negative curva- ture, like a saddle, while others are classic examples of surfaces with constant positive curvature, like the spherical bubbles. Soap bubbles have lead to some intriguing mathematical discoveries as well, as we will see below.

In a state of equilibrium, the surface tension on a soap film is the same at all points, and its surface area will have a minimal value; this minimum area property of soap films can be used to solve some mathematical minimization problems.


 Download PDF (For Printing)  Back to Network Graph
X

Turn the handle and watch the patterns. What is happening? Movement of one piece causes the piece hinged to it to move, and the process continues. The strings not only support the hinges, but also help control the motion of the pieces. In a way, this pattern is not exactly a sine wave as written in the equation above, but is only an approximation that visually resembles a sine wave.


 Download PDF (For Printing)  Back to Network Graph
X

A pendulum is just a swinging object, for example, a swing. In this exhibit, the swinging object itself has swinging parts - called a double or triple pendulum. Such pendulums can have “chaotic” - not random - motions. You will notice that small changes in the initial position of the two identical pendulums causes a very large variation in their path.

You would think that chaos is a phenomena observed at any busy intersection in any city in India! No – not quite – that is just disorder and confusion. Chaotic systems have the essential characteristic that very small changes at one time lead to very large changes at later times. That’s why they are hard to predict – we need very accurate knowledge of the system to predict it without a large uncertainty. A prime example is the weather: we cannot really predict the weather even a few days in advance

Where do such chaotic systems occur? There are many examples: changes in weather (tempera- ture, rainfall), motions of some of the comets, the pattern of heartbeats, the economic activity, the movement of a stream flowing down a mountain, and many others. Contrast this with the regular motion of a fan, or of the harmonograph or the Lissajous pendulum (which are all non-chaotic), or changes in stock market (which are essentially random).


 Download PDF (For Printing)  Back to Network Graph
X

Harmonograph is essentially a compound pen- dulum with multiple separate pendulums operating at right angles to each other. The combined oscillations of these pendulums give rise to a pattern called Lissajous’ figures. When the different weights hanging from the harmonograph are set swinging at the same time, the observer sees su- perposition (that is, the sum) of the oscillations of these pendulums. This superposition can give rise to the complex patterns that are drawn on the paper. Different phases and amplitudes of the pendulums give rise to an endless variety of patterns. The visitor starts the pendulums swinging and controls their relative phase.

The exhibit on Lissajous’ figures is similar to the harmonograph. The two different oscillations at right angles to each other are achieved by a special arrangement of the “Y” shaped yoke from which the pendulum hangs. When the pendulum is swung, the special pivot enables the same pendulum to operate as two pendulums with different lengths at right angles. As a result, the painting pendulum traces patterns known as Lissajous’ figures.


 Download PDF (For Printing)  Back to Network Graph
X

This exhibit is an extension of the tensegrity structure concept that brings out a further advantage or effectiveness, namely robustness and structural stability. For the struc- ture to weather a storm or a tremor, it needs to absorb sudden shocks and regain the original form

Where do these occur? Spider web example again relates this aspect to the fact that the web isn’t easily destroyed by strong winds or by violent disturbances caused at the anchored ends. Being one of the most commonly found designs in nature, the radial threads connected to fixed objects are crisscrossed by the spiral threads to form an optimal design. It is strong enough to hold a large prey and at the same time flexible enough to sustain strong wind blows. Recent studies show that if few local threads are broken, the overall loading capacity of the web is in fact increased, proving the robustness of the structure. When a prey is trapped, the spider gets the message through the vibrations of threads. The patterns of interwoven threads enables the spider to spot the prey in an efficient manner.

 Download PDF (For Printing)  Back to Network Graph
X

Vibrations of any structure - a building, a bridge, a violin string - show characteristic patterns and characteristic frequencies. These patterns depend on the shape and size of the structure, on the material used, on its mass. When winds or earthquakes shake these structures at these characteristic frequencies, they “resonate” and this resonance can lead to large oscillations.

Knowledge of these vibrations, which can be calculated using mathematical equations describing them, helps engineers build structures which can withstand earthquakes, or strong winds and waves. This exhibit shows the vibrating patterns of a square aluminum plate. Add a little sand (sooji!) and adjust the frequency and see how the patterns are formed.

These is a natural relationship between these vibrations and waves. As we saw earlier, vibrations of one part of the plate cause adjacent parts to start vibrating, and this leads to waves moving on the surface of the plate. What we are seeing here is the result of many different waves coming together to cause what are known as standing

Wave Tube: The waves that we see on the surface of the two fluids clearly remind us of waves that you can see on a river, on the surface of a lake or the sea, even in the clouds in the sky – or if you stretch your imagination a little, a tsunami (though tsunami is quite a different type of wave than those seen here).

Turn the knob to tilt the glass tube to one side and observe the formation of waves in the blue liquid. The upper half of the tube is filled with a lighter, colourless liquid - kerosene while the lower half contains a viscous liquid - tinted glycerol. The waves formed in the interface of the two immiscible liquids demonstrate the characteristics of both the transverse and the longitudinal waves at the same time. Do you see any similarity between these waves and the waves on the surface of the ocean?


 Download PDF (For Printing)  Back to Network Graph
X

Have you heard of this exotic wave: a solitory wave or soliton? This exhibit gives a visual representation of what a soliton wave may look like (even though it is not exactly a soliton wave itself).

These soliton waves (i) maintain their shape as they move, and (ii) can emerge unscathed after a collision with another soliton. They are also special, because the “louder” they are, the faster they move. Contrast this with the “usual” waves such as the sound or the light – their speed does not depend on their loudness.

Where do solitons occur? Solitons were first observed on surface of water, but they also occur in optical fibres used to form the network that carries internet data, in some DNA and other biopolymers.


 Download PDF (For Printing)  Back to Network Graph
X

‘Tensegrity' is an amalgamation of two words `Tension' and `Integrity.' Tensegrity concept is mainly about the judicious use of available material to create a structure that is both stable and spans a large area; it is used to build structures which employ an economy of material and obtain optimal results. Tensegrity structures contain two types of components to achieve this purpose: the struts which lend strong support, that is the integrity part, and the cables that maximize the span by stretching or tension. In other words, strong struts connected together by flexible cables hold the structure together in optimal tension.

Where do such structures occur? In nature, spider webs demonstrate this concept effectively: they contain strong structural supports, the radial threads and a few polygonal threads, and the rest of the web is woven around it. Mathematically, tensegrity is a configuration of points, or vertices, that satisfy some simple distance constraints. Cables keep vertices close together and struts hold them apart. Another main purpose in building structures employing this concept is also to achieve quick assembling and dissembling so as to enable ease of transportation.

The tensegrity stool is one example of this structural concept. It basically consists of rods and strings connected together to support either a human or an object placed on it.

 Download PDF (For Printing)  Back to Network Graph
X

Symmetry abounds in nature. In every glance our eyes notice, almost seek out, symmetry. Nature shows us symmetry in abundance. Whether we look at the shell of a tortoise, a honeycomb (beehive) or even plant tissue through a microscope we find a discernible pattern. A pattern that is repeated over and over. It is this symmetry that is reflected in almost all designs made by humans as well. A tessellation is a way of covering a (flat) surface with tiles in such a manner that there are no gaps or overlaps. The idea behind building a tessellation is simple; take a pattern or tile and repeat it over the entire surface. Just like a plasterer mason tiles a floor! There are many different types of tessellations – different shapes can be used to tile a surface. The most commonly seen tiles are polygons.

Regular Tessellations. A regular tessellation is a pattern which uses polygons to tile a planar surface. A polygon with n sides is called an n-gon. For instance, a triangle is a 3-gon; a square, rectangle or a quadrilateral is a 4-gon; a pentagon is a 5-gon; and so on. Strictly speaking a regular tessellation uses exactly one type of tile, like the patterns usually seen on the floor, or in a honeycomb. The simplest way to tile a surface is to use a regular n-gon as a tile. A regular n-gon is an n-gon where all sides have equal length, like an equilateral triangle or a square. Ever wonder why we don’t see pentagons used to tile a surface? As illustrated by the exhibit, when one uses equilateral triangles, squares or regular hexagons then it is possible to construct a tessellation. But it doesn’t work with regular pentagons.

 Download PDF (For Printing)  Back to Network Graph